
1 Load flight data
Drop a CSV here or click to browse
Raw Kestrel 5500 / Aeropod Profiler export (multiple flights OK)Don't have a file handy? Load the FlyForever / Oregon Inlet 3-29-26 Delta Conyne flight that ships with this tool.
Loading…
About the Aeropod Profiler
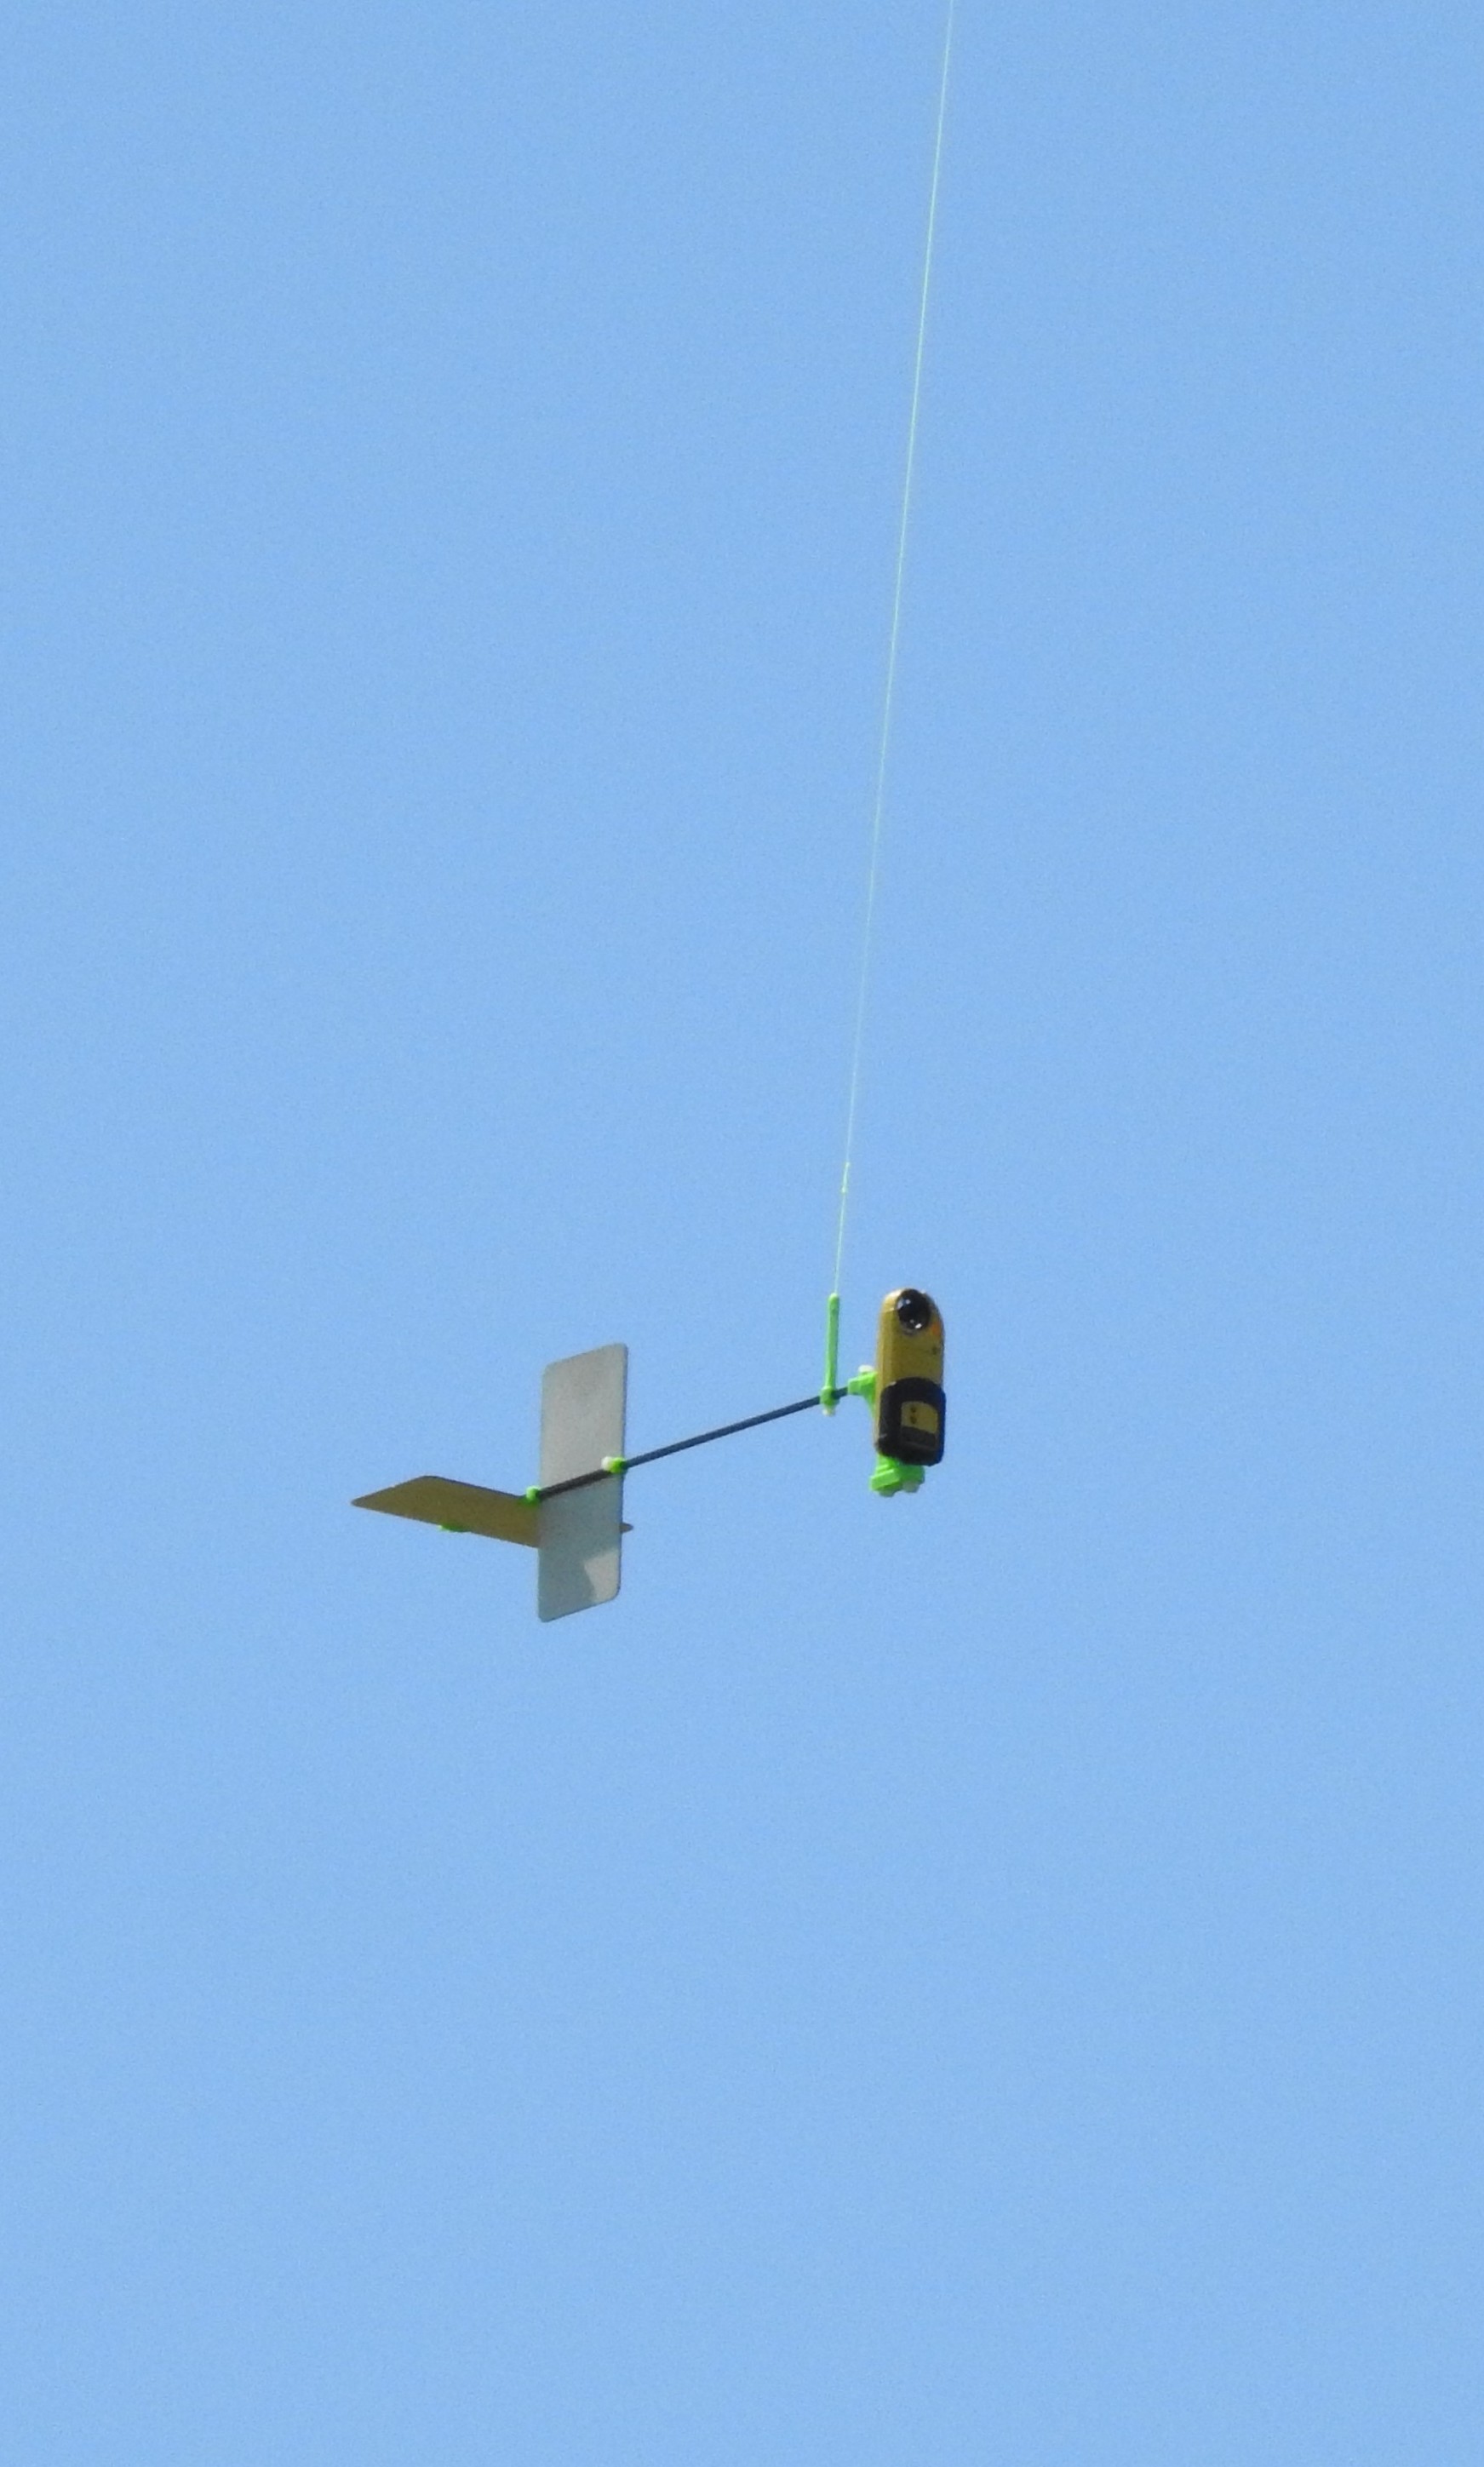
The Aeropod Profiler is a lightweight payload flown beneath a kite (here a Delta Conyne) as part of NASA/GLOBE's AREN project (Aerokats & Rover Education Network). A Kestrel 5500 weather meter logs temperature, humidity, pressure, wind, and barometric altitude every couple of seconds as the kite rises and falls, producing a vertical profile of the lower atmosphere.
This tool reproduces the plots from the project's reference spreadsheet — altitude-vs-time time series, wind/temperature/humidity profiles, and potential-temperature θ — and adds interactive zoom/pan, multi-variable comparison on linked axes, a 3D site view, and one-click PNG export of the current view.
Derived fields: Temp °C = (°F−32)·5⁄9 · BP mBar = inHg⁄29.921·1013.21 · Alt AGL = raw altitude − ground · Wind m/s = mph·0.447 · θ(K) = (°C+273.15)·(1000/mBar)0.286.